Getting Started
Quick Start guide, the theory behind Skylight, and more stuff you need to know to get up and running with Skylight.
Quick Start
First, check that your app meets the requirements to run Skylight. If so, huzzah! Carry on.
-
Visit the Skylight app to get your setup token.
- Add Skylight to all environments in your Gemfile.
 # Gemfile
 gem "skylight"
- Run the following commands in your development environment:
 # Shell
 bundle install
 bundle exec skylight setup <setup token>
This will automatically generate your
config/skylight.ymlfile. - Deploy your application to production.
IMPORTANT:
The contents of the skylight.yml file should be considered secret, so if your application is open source, you will not want to commit it to your repo. See Setting Authentication Tokens to learn how to set an environment variable instead.
See the Advanced Setup section for more details on setting environment variables, using custom configuration, setting up multiple environments, and using Skylight on a framework other than Rails.
Pro Tip:
Setting up an open source app? See the detailed setup instructions.
Feature Overview
Actionable Insights
Skylight makes it easy to understand and act on your app’s performance data:
- True Response Times and Request Aggregation prevent you from going on a wild goose chase.
- Sorting by Agony puts the endpoints most in need of improvement at the top of your list.
- Heads Ups notify you to potential code issues that may slow down your app.
App Dashboard

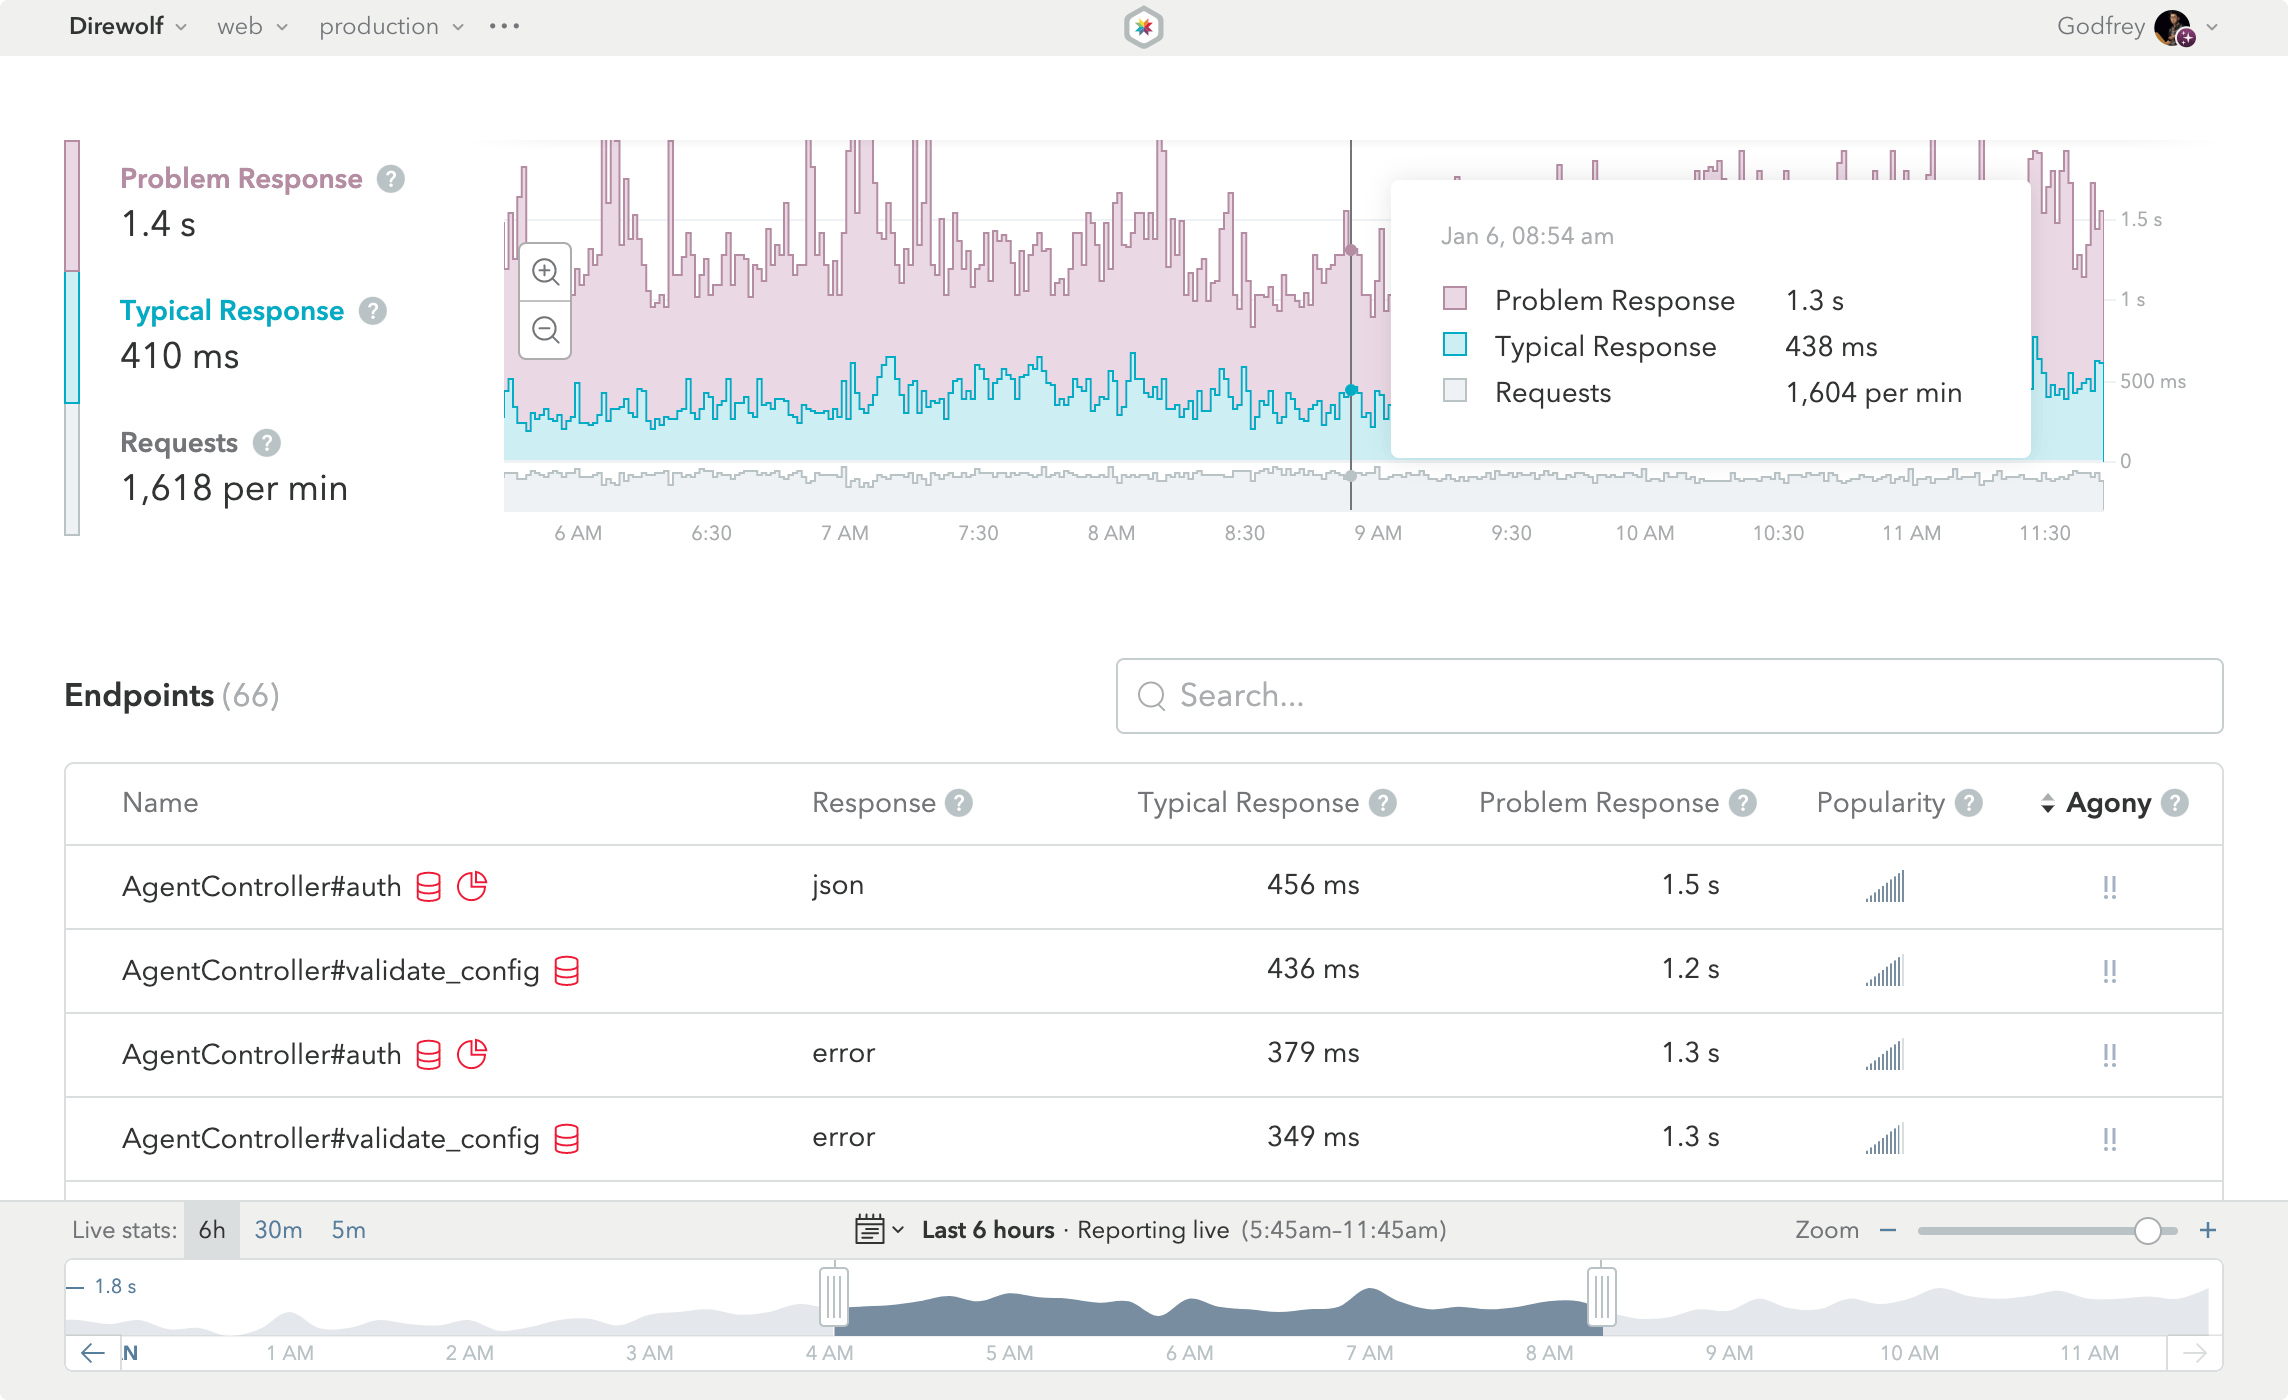
This is the App Dashboard, the first thing you’ll see when you log into Skylight. The dashboard gives you a high-level view of how your app is performing and acts as a starting point for digging into the details.
See Navigating Your App to learn more.
Endpoint View

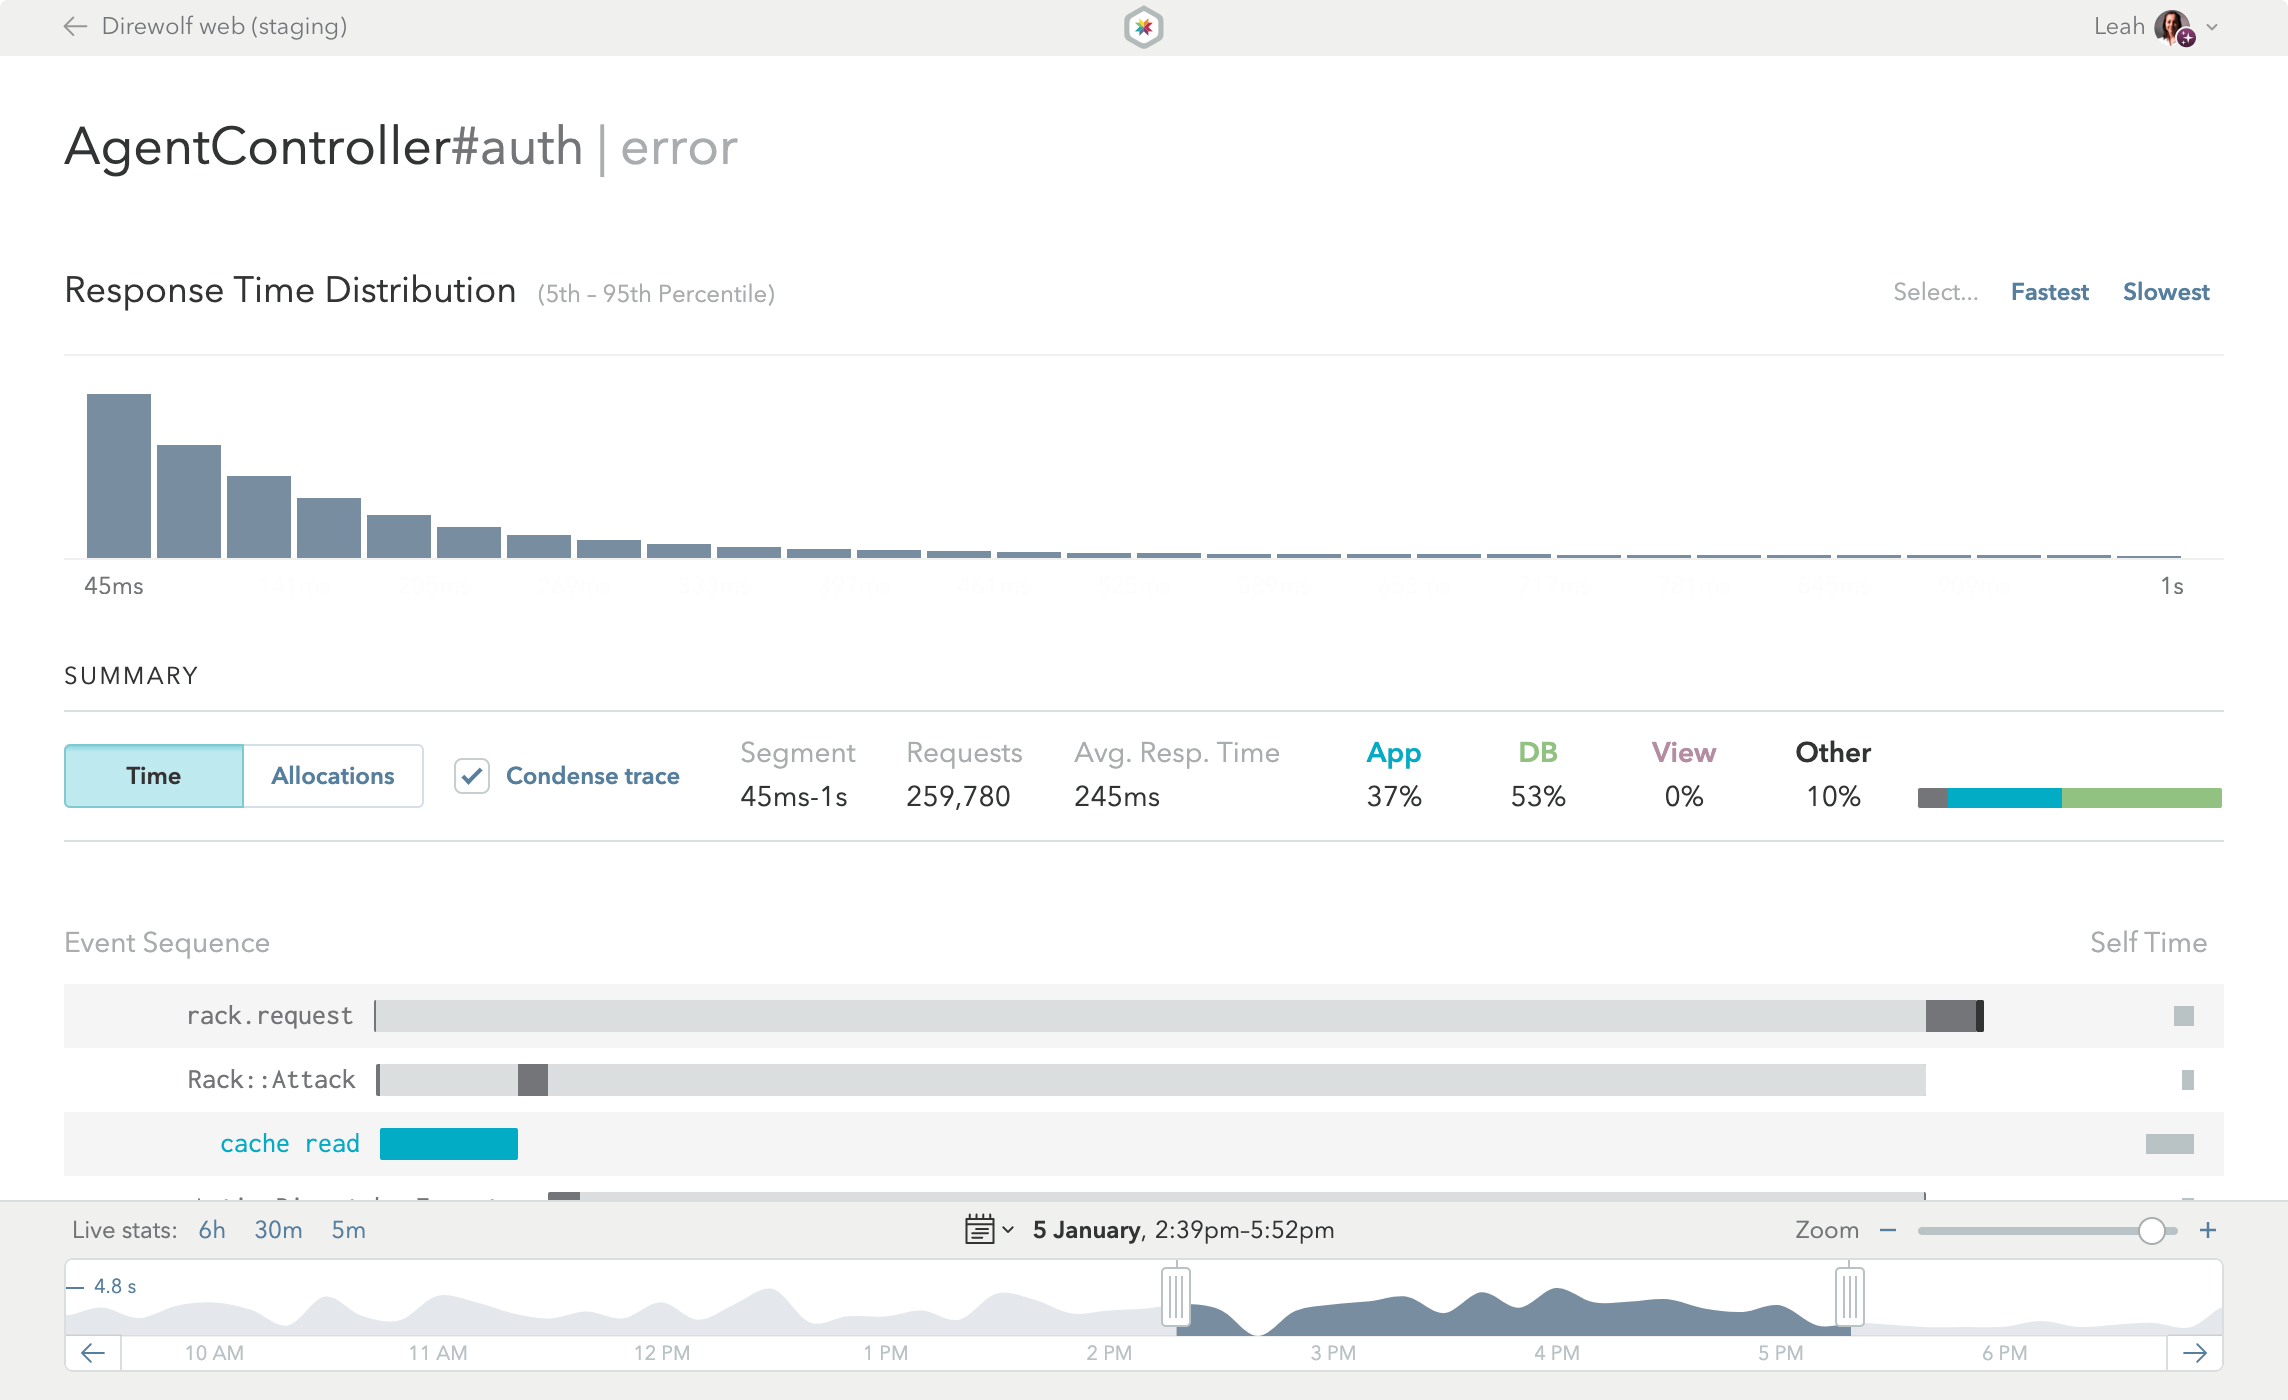
The Endpoint View is the heart and soul of Skylight. More than just looking pretty, this page is the end result of distilling thousands of data points into actionable information that you can use to speed up your app.
See Navigating Your Endpoint to learn more.
Trends

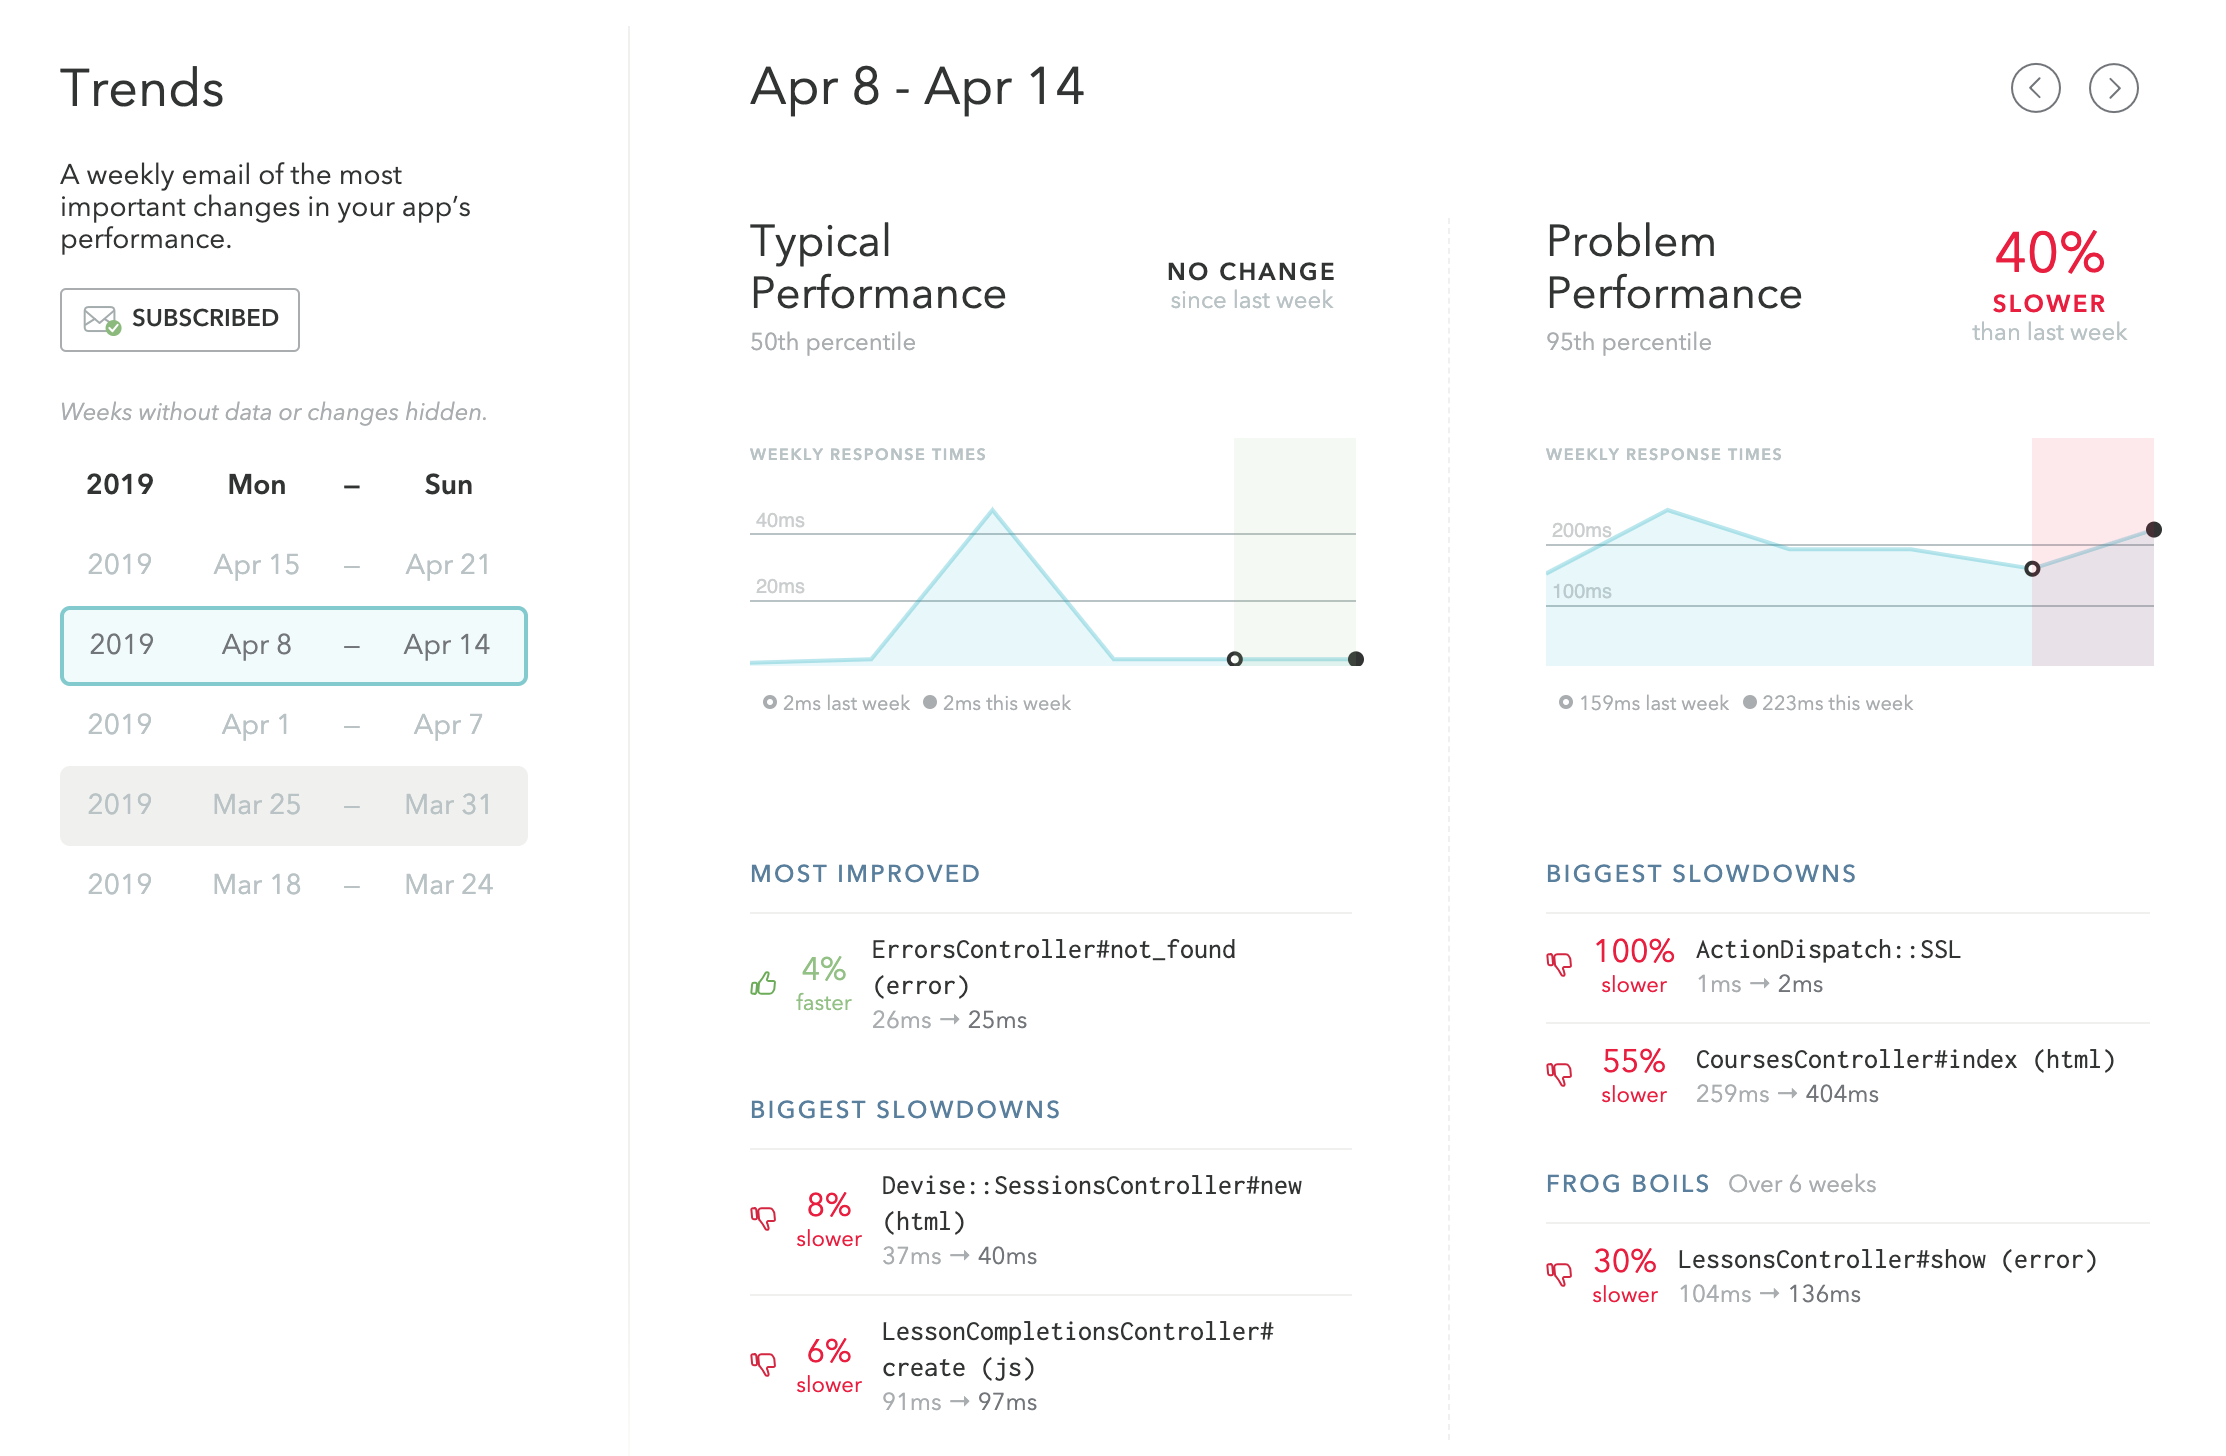
Our trends feature distills your performance data into a weekly report that helps you catch slowdowns before your customers do.
See Staying the Course to learn more.
The Theory Behind Skylight
Answers, Not Data
Rather than bog you down with a zillion charts and graphs, Skylight turns performance data into actionable insights, so you spend less time diagnosing and more time improving.
Our user interface is pretty and fun to use. We’ve optimized it to provide maximum insight with minimal distractions. We work very hard to make Skylight’s UI approachable, with the attitude that providing more data is a worse experience if it can’t be presented correctly.
We focus on the features that actually help you improve your app, such as Agony to prioritize improvements, heads up to spot potential code mistakes, and the Event Sequence to determine where your app is spending the most time.
Don’t struggle to learn why your app is slow. Get answers with Skylight.
True Response Times

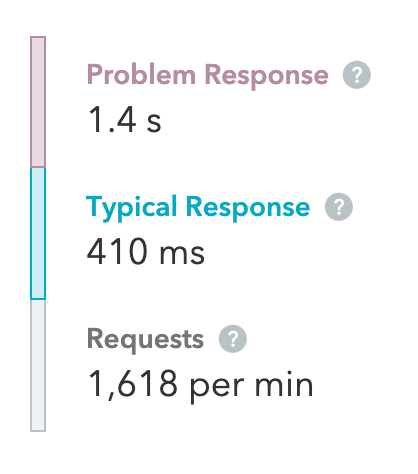
Your application’s response times appear several places in Skylight. In most cases we talk about the numbers in one of two ways. The “problem” response time is the 95th percentile, whereas the “typical” response time is the median (50th percentile).
Most tools only show averages, which are easy to calculate but provide limited usefulness on their own. In Skylight, we always show the 95th percentile response time as well. While this takes significantly more computation on the backend to determine, it is a much, much better number to indicate real world performance.
Averages are almost useless when thinking about web performance, and in the worst case, are actually misleading. For more information, see DHH’s blog post, The Problem with Averages. Google, Twitter, and GitHub (to name a few) all use 95th percentile numbers when tracking performance.
Learn more about Skylight’s approach to percentiles at our blog.
Aggregation vs. Sampling
Most other profiling tools rely on sampling to give you detailed information about endpoints. While this provides some value, it doesn’t provide you information about every request. Depending on how frequently the sample happens, it’s quite likely that it will miss spikes and unusual behavior.
In Skylight, we track information about every request. We then aggregate the data to provide a representative picture of your application, dropping only the outliers. This means that no request is ignored, and we can give you a full and accurate picture of your application.